Categories
news

Signal Transduction Reaction Monitoring Deciphers Site-Specific PI3K-mTOR/MAPK Pathway Dynamics in Oncogene-Induced Senescence

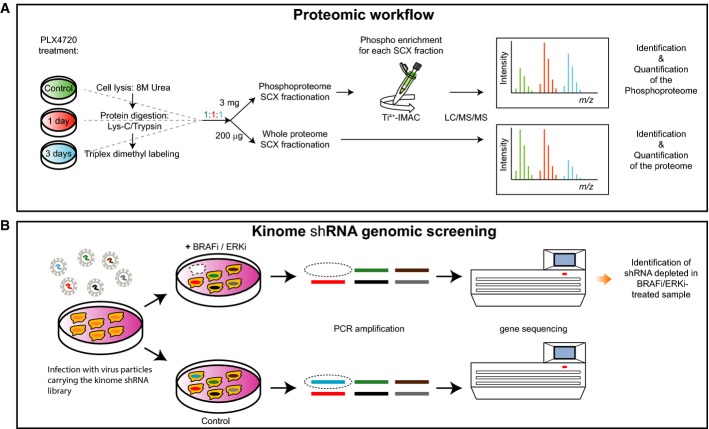
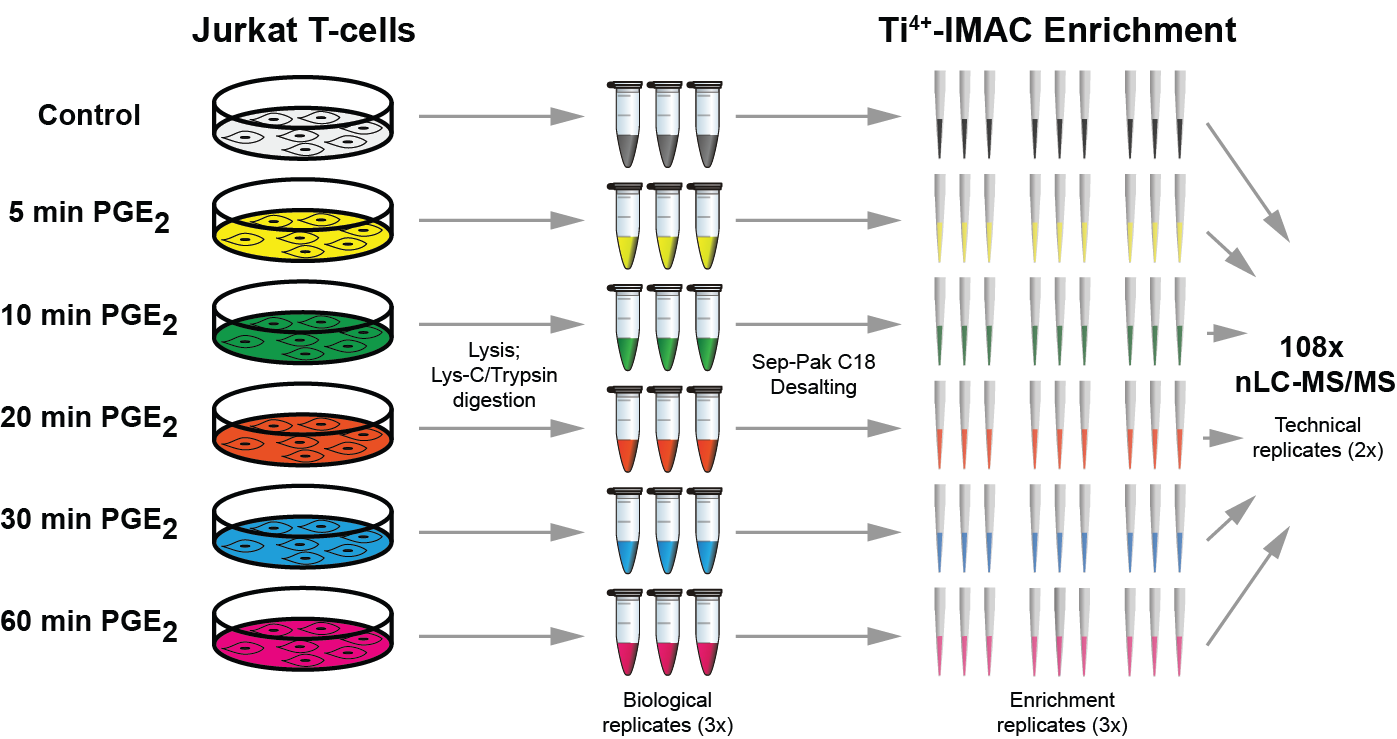
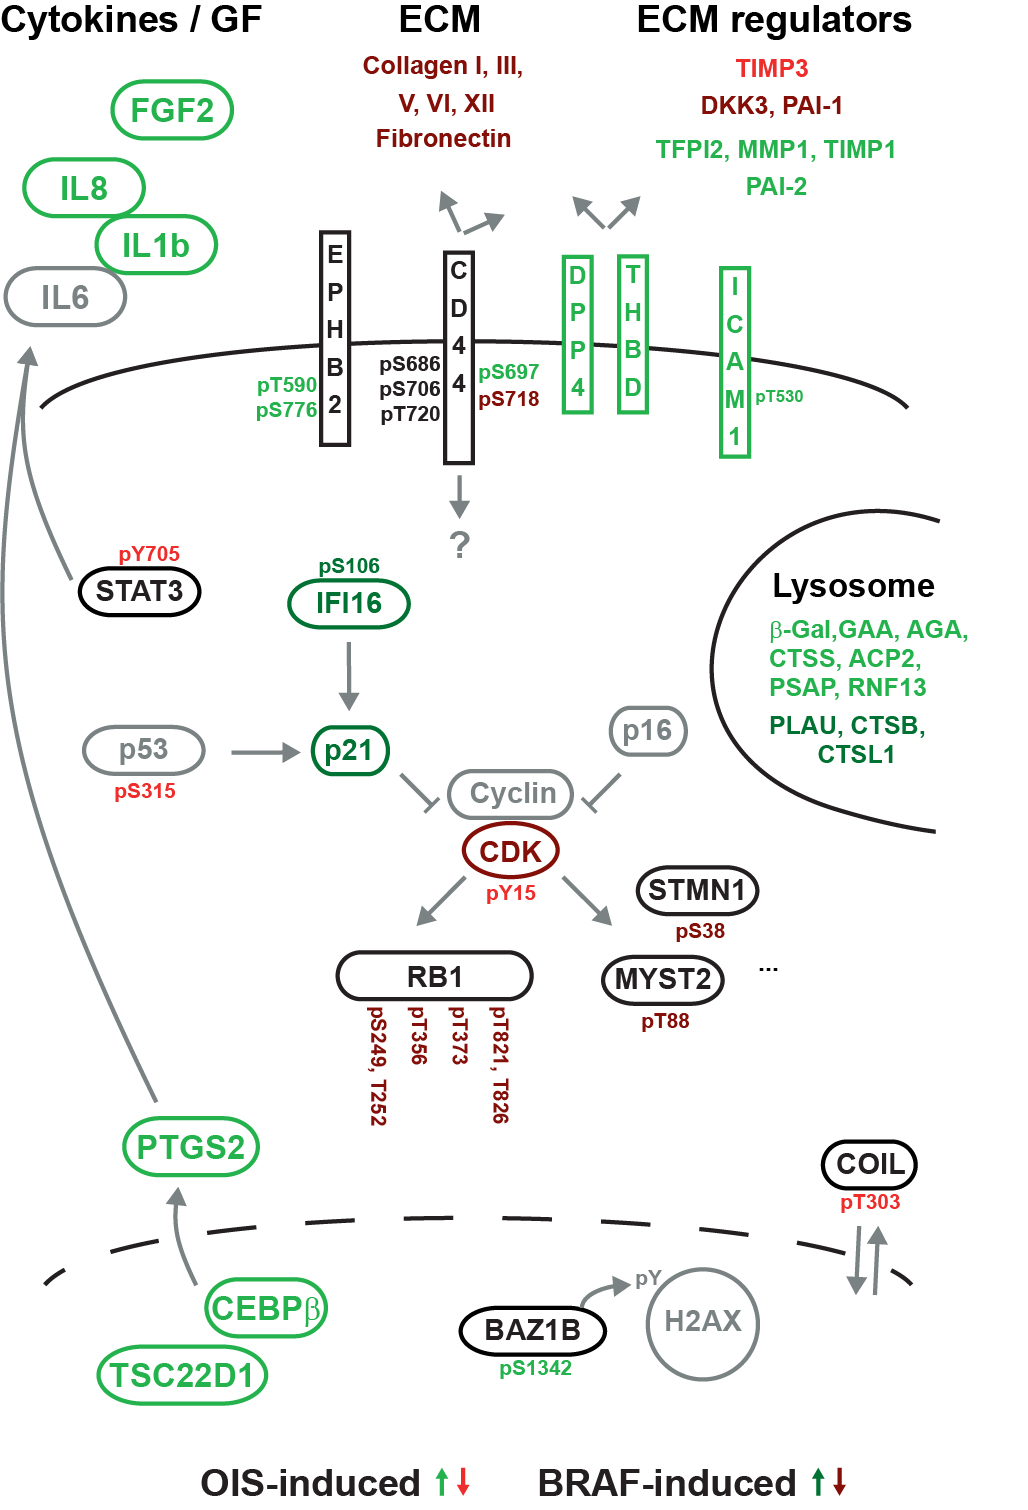
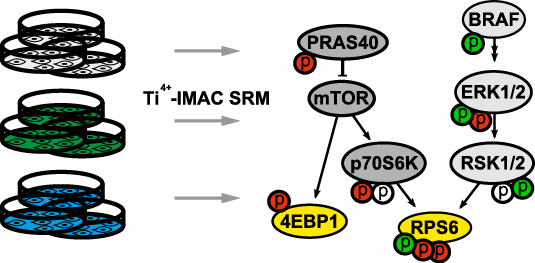
We report a straightforward strategy to comprehensively monitor signal transduction pathway dynamics in mammalian systems. Combining targeted quantitative proteomics with highly selective phosphopeptide enrichment, we monitor, with great sensitivity, phosphorylation dynamics of the PI3K-mTOR and MAPK signaling networks. Our approach consists of a single enrichment step followed by a single targeted proteomics experiment, circumventing the need for labeling and immune purification while enabling analysis of selected phosphorylation nodes throughout signaling pathways. The need for such a comprehensive pathway analysis is illustrated by highlighting previously uncharacterized phosphorylation changes in oncogene-induced senescence, associated with diverse biological phenotypes and pharmacological intervention of the PI3K-mTOR pathway.

de Graaf EL, Kaplon J, Mohammed S, Vereijken LA, Duarte DP, Redondo Gallego L, Heck AJ, Peeper DS, Altelaar AF.

J Proteome Res. 2015 Jul 2;14(7):2906-14.

Categories
highlights

ROCK1 is a potential combinatorial drug target for BRAF mutant melanoma

Treatment of BRAF mutant melanomas with specific BRAF inhibitors leads to tumor remission. However, most patients eventually relapse due to drug resistance. Therefore, we designed an integrated strategy using (phospho)proteomic and functional genomic platforms to identify drug targets whose inhibition sensitizes melanoma cells to BRAF inhibition. We found many proteins to be induced upon PLX4720 (BRAF inhibitor) treatment that are known to be involved in BRAF inhibitor resistance, including FOXD3 and ErbB3. Several proteins were down-regulated, including Rnd3, a negative regulator of ROCK1 kinase. For our genomic approach, we performed two parallel shRNA screens using a kinome library to identify genes whose inhibition sensitizes to BRAF or ERK inhibitor treatment. By integrating our functional genomic and (phospho)proteomic data, we identified ROCK1 as a potential drug target for BRAF mutant melanoma. ROCK1 silencing increased melanoma cell elimination when combined with BRAF or ERK inhibitor treatment. Translating this to a preclinical setting, a ROCK inhibitor showed augmented melanoma cell death upon BRAF or ERK inhibition in vitro. These data merit exploration of ROCK1 as a target in combination with current BRAF mutant melanoma therapies.

Smit MA1, Maddalo G2, Greig K1, Raaijmakers LM3, Possik PA1, van Breukelen B3, Cappadona S3, Heck AJ3, Altelaar AF4, Peeper DS5.

Mol Syst Biol. 2014 Dec 23;10:772. doi: 10.15252/msb.20145450

Categories
highlights

Single-step enrichment by Ti4+-IMAC and label-free quantitation enables in-depth monitoring of phosphorylation dynamics with high reproducibility and temporal resolution.

Quantitative phosphoproteomics workflows traditionally involve additional sample labeling and fractionation steps for accurate and in-depth analysis. Here we report a high-throughput, straightforward, and comprehensive label-free phosphoproteomics approach using the highly selective, reproducible, and sensitive Ti(4+)-IMAC phosphopeptide enrichment method. We demonstrate the applicability of this approach by monitoring the phosphoproteome dynamics of Jurkat T cells stimulated by prostaglandin E2 (PGE2) over six different time points, measuring in total 108 snapshots of the phosphoproteome. In total, we quantitatively monitored 12,799 unique phosphosites over all time points with very high quantitative reproducibility (average r > 0.9 over 100 measurements and a median cv < 0.2). PGE2 is known to increase cellular cAMP levels, thereby activating PKA. The in-depth analysis revealed temporal regulation of a wide variety of phosphosites associated not only with PKA, but also with a variety of other classes of kinases. Following PGE2 stimulation, several pathways became only transiently activated, revealing that in-depth dynamic profiling requires techniques with high temporal resolution. Moreover, the large publicly available dataset provides a valuable resource for downstream PGE2 signaling dynamics in T cells, and cAMP-mediated signaling in particular. More generally, our method enables in-depth, quantitative, high-throughput phosphoproteome screening on any system, requiring very little sample, sample preparation, and analysis time.

de Graaf EL, Giansanti P, Altelaar AF, Heck AJ.

Mol Cell Proteomics. 2014 Sep;13(9):2426-2434.

Categories
highlights

Phosphoproteome dynamics in onset and maintenance of oncogene-induced senescence.

Expression of the BRAF(V600E) oncoprotein is known to cause benign lesions, such as melanocytic nevi (moles). Despite the oncogenic function of mutant BRAF, these lesions are arrested by a cell-autonomous mechanism called oncogene-induced senescence. Infrequently, nevi can progress to malignant melanoma, through mechanisms that are incompletely understood. To gain more insight into this vital tumor-suppression mechanism, we performed a mass-spectrometry-based screening of the proteome and phosphoproteome in cycling and senescent cells and in cells with abrogated senescence. Proteome analysis of senescent cells revealed the up-regulation of established senescence biomarkers, including specific cytokines, but also several proteins not previously associated with senescence, including extracellular matrix-interacting. Using both general and targeted phosphopeptide enrichment by Ti(4+)-IMAC and phosphotyrosine antibody enrichment, we identified over 15,000 phosphorylation sites. Among the regulated phosphorylation sites we encountered components of the interleukin, BRAF/MAPK, and CDK-retinoblastoma pathways and several other factors. The extensive proteome and phosphoproteome dataset of BRAF(V600E)-expressing senescent cells provides molecular clues as to how oncogene-induced senescence is initiated, maintained, or evaded, serving as a comprehensive proteomic basis for functional validation.

de Graaf EL, Kaplon J, Zhou H, Heck AJ, Peeper DS, Altelaar AF.

Mol Cell Proteomics. 2014 Aug;13(8):2089-2100.